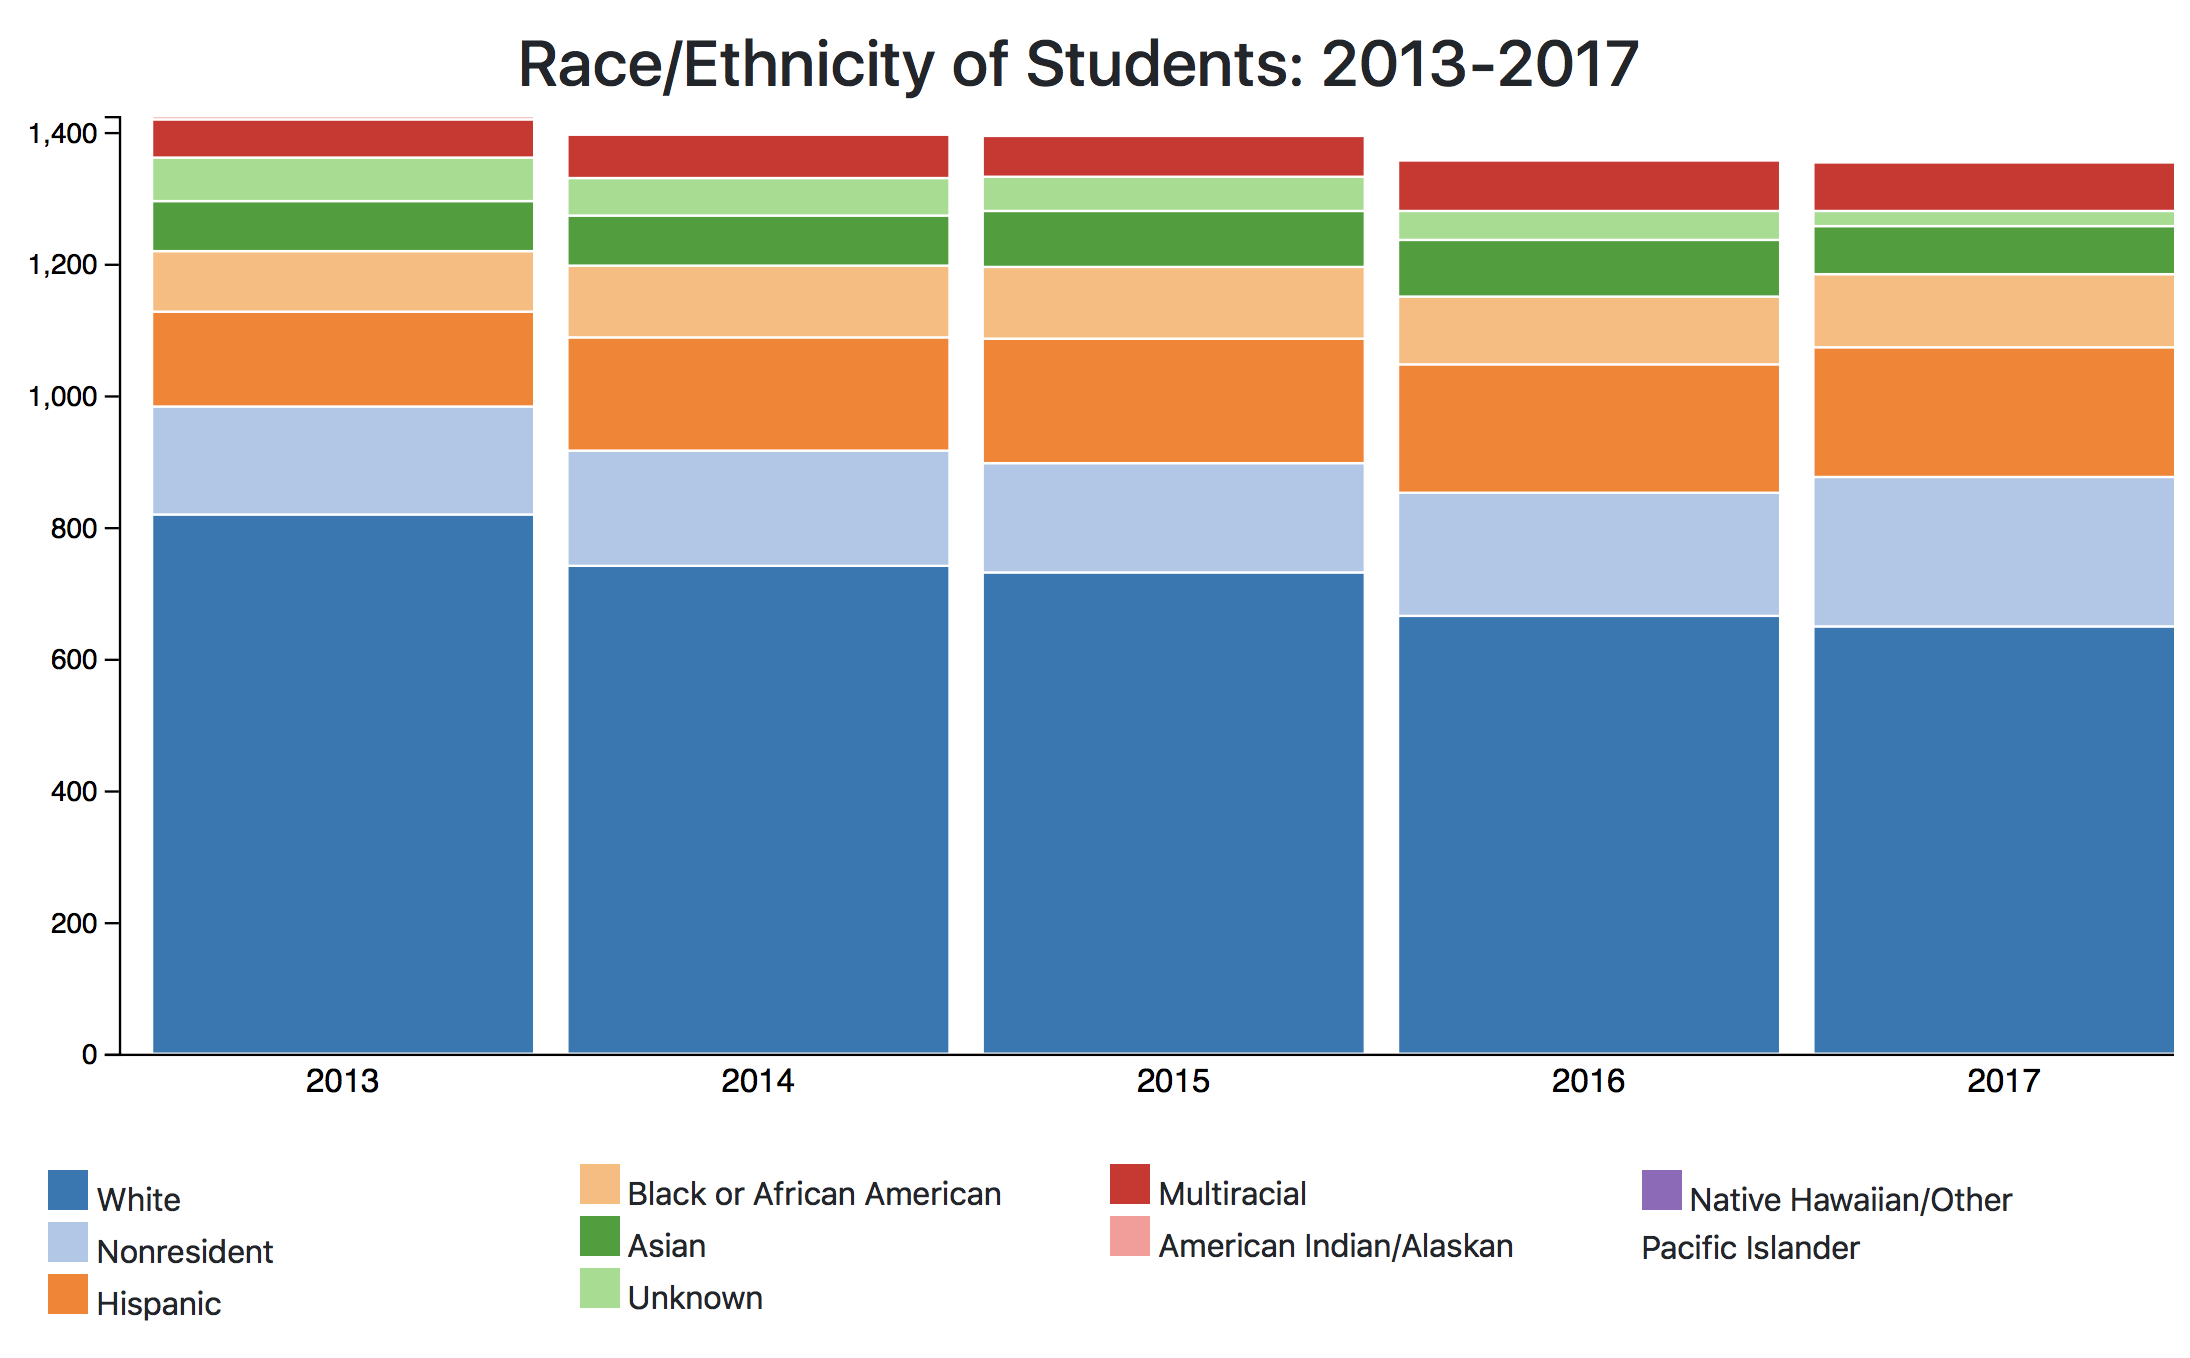
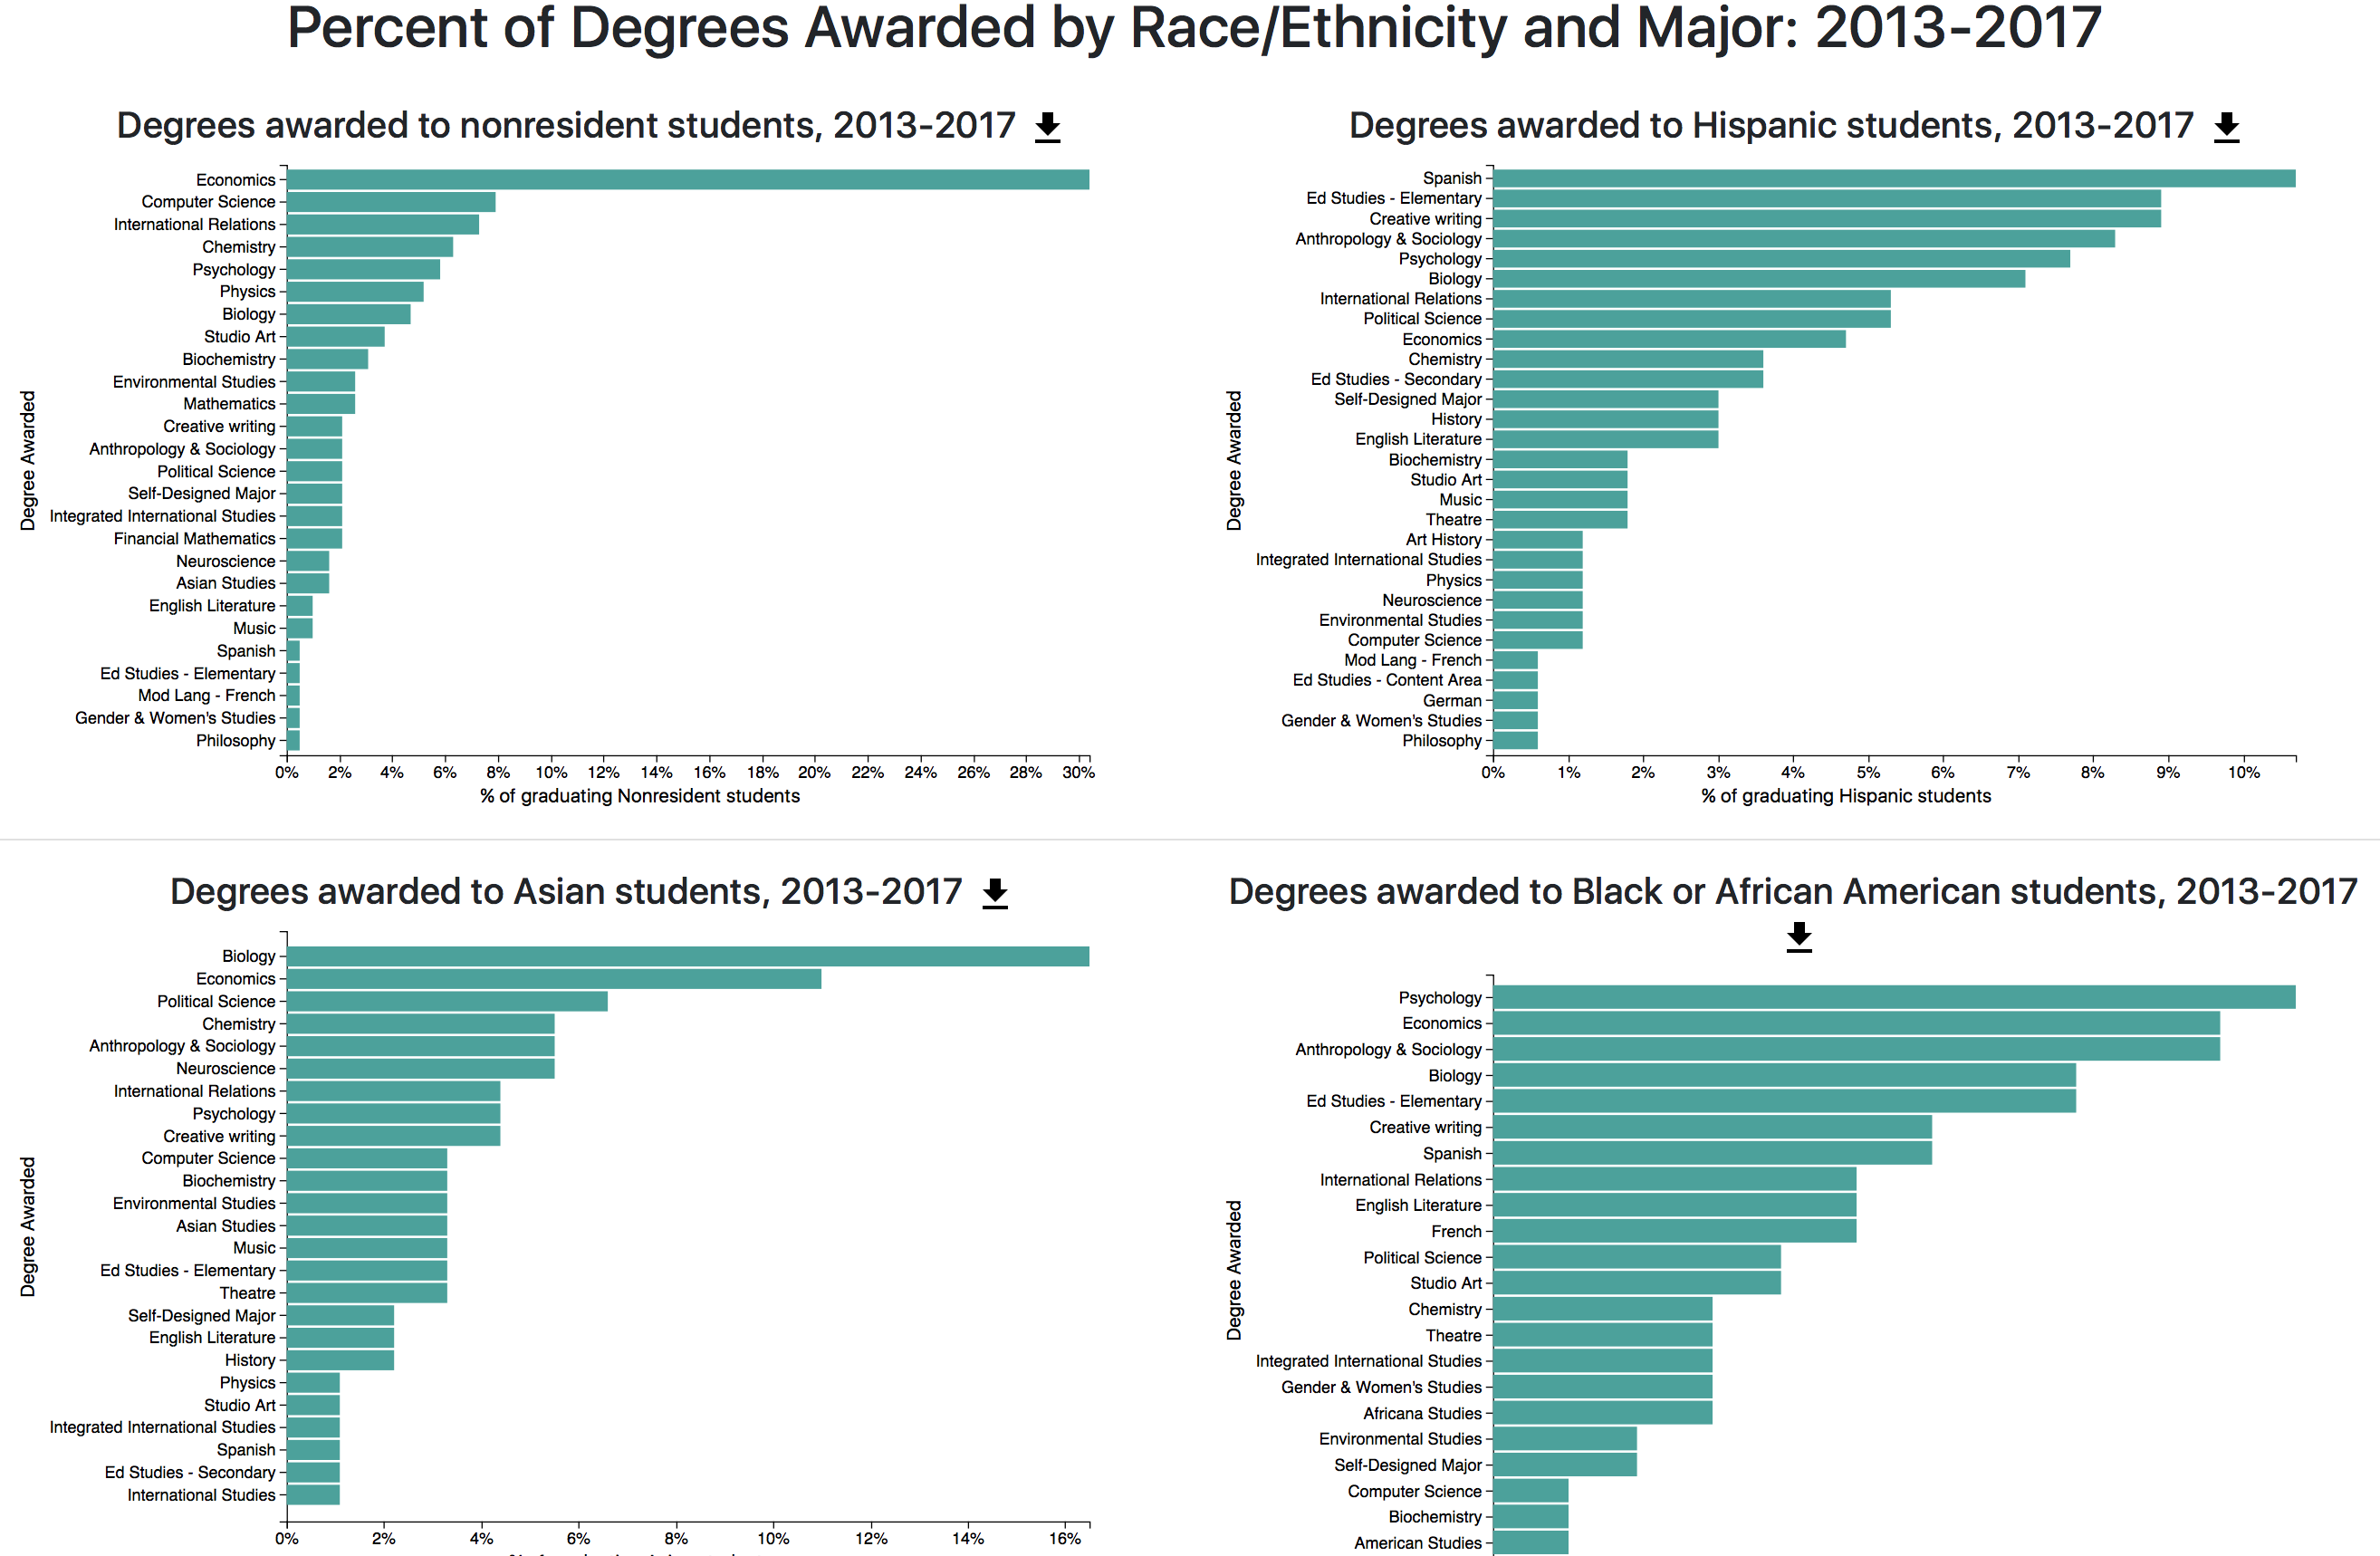
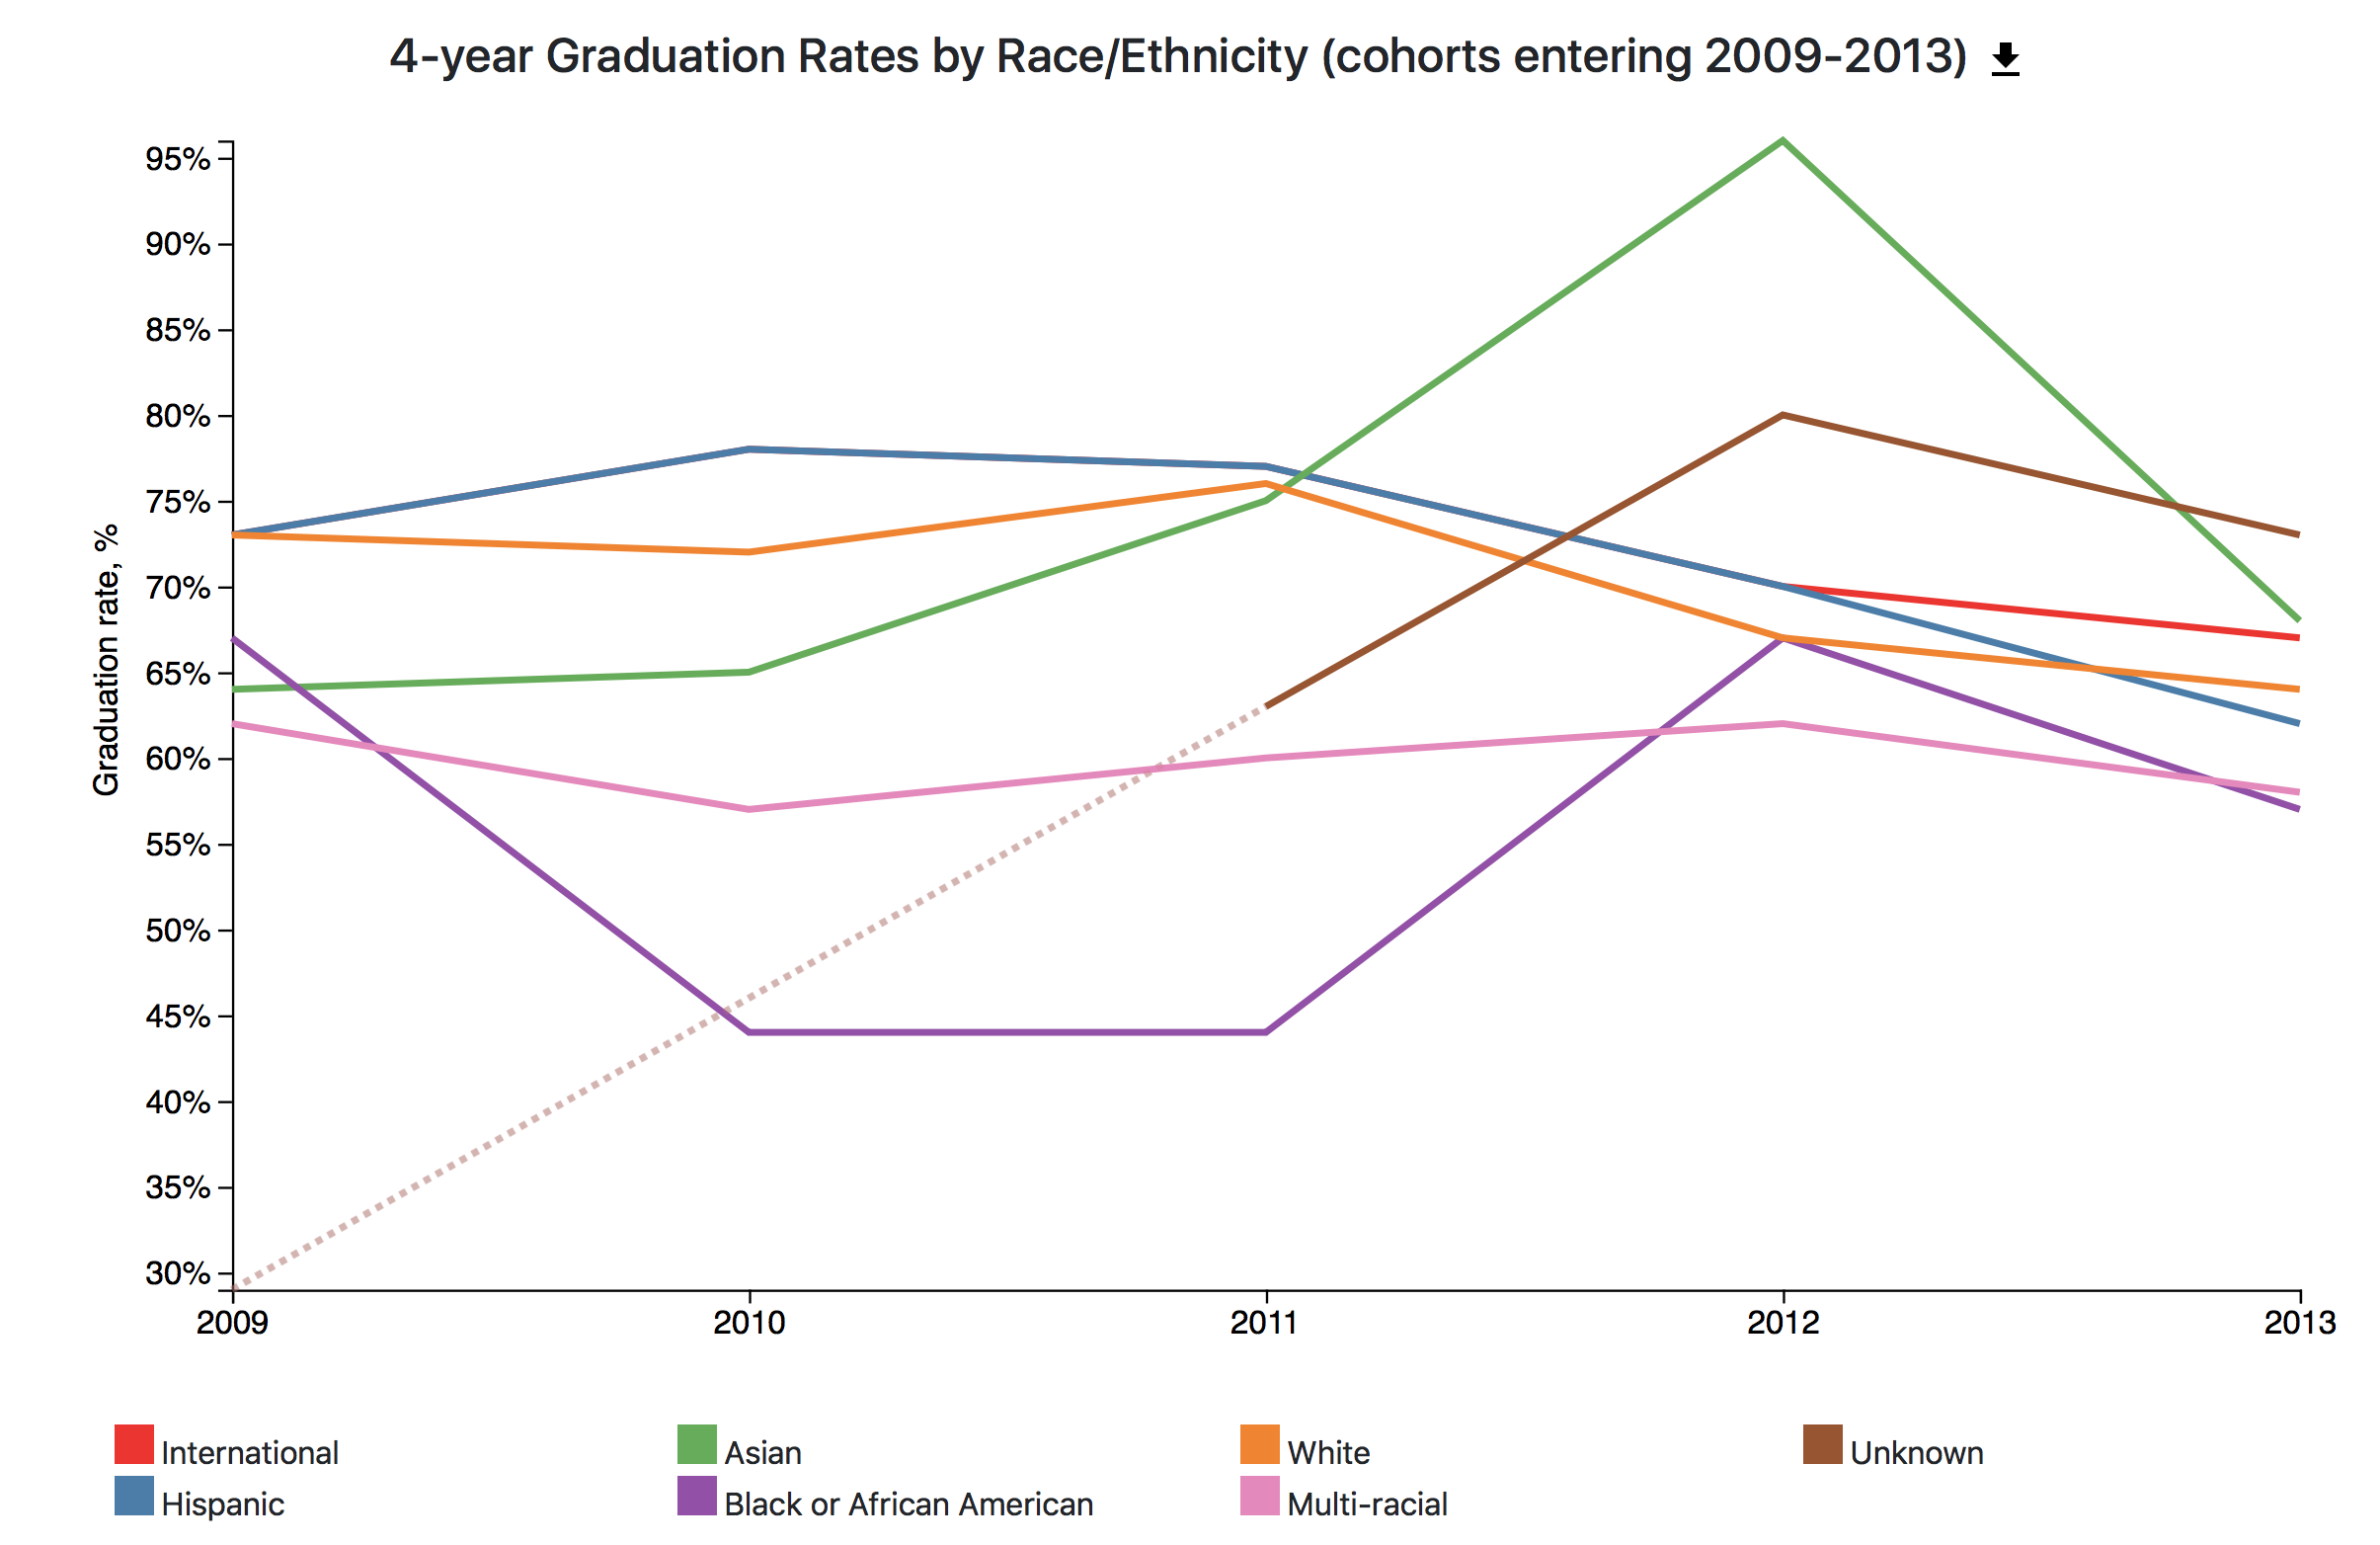
Knox College Race/Ethnicity Visualizations
What is this?
This is a data visualization project done for the Knox College Student Senate Diversity Committee in 2017/2018. All data were provided by the committee, and can be downloaded here in their original form. The data were visualized (to varying degrees of success) by Michelle Dudley using d3.js and lots of tutorials.
Contact me here with questions, comments, or corrections


